Money market equilibrium refers to situation where, at the given rate of interest, demand for money equals supply of money in the market. Given the supply of money, the rate of interest moves up or down in a manner that ultimately equates the demand for money to its given supply and thus bring about the money market equilibrium. Here we assume that money market supply is given and the rate of interest is free to vary, so as to bring about equilibrium in the demand and supply of money.
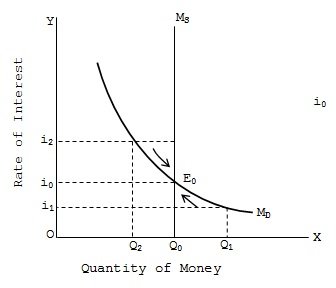
The money market equilibrium is diagrammatically shown at a point where negatively sloped money demand curve (liquidity preference curve) intersects the fixed quantity (inelastic) money supply curve as shown it can be seen that the rate of interest i0 given by the intersection of money demand curve MD and money supply curve MS at point E0 equals money demand and money supply. At a lower interest rate i1 there is excess demand for money that pushes interest rate upwards and at higher interest rate i2 there is excess supply that pulls the interest rate downwards. So, i0 is the equilibrium interest rate which establishes equilibrium in the money market.
SUBMIT ASSIGNMENT NOW!