A supply curve is a graphical representation of the supply schedule. In the quantity of tea offered for sale is taken on the X – axis and the price is taken on the Y – axis. By plotting the various amounts of tea supplied at various prices we get the points S1 , S2, S3 and so on. By joining these points, the supply curve of the commodity is drawn.
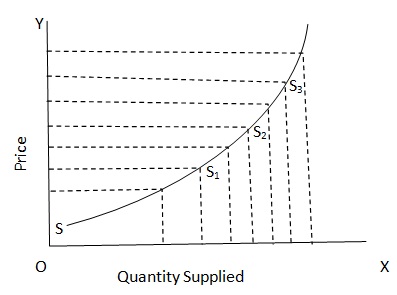
The supply curve is upward sloping showing that more would be offered for sale at a higher price. But why more is offered for sale at the higher price? What explains the upward slope of the supply curve? This is very simple to explain. The total supply in the market is the sum total of the supplies made by the individual firms. Now each firm, in order to maximize its profits, would sell that much where the market price is equal to their marginal cost of production. If the price is more than the marginal cost, there will be abnormal profits and therefore the firm would expand its production. Thus at a higher price, the existing firms would supply more. Similarly, those producers who did not enter into the market because the price did not cover their marginal cost of production, would also come in and supply goods when the price rises. Hence, total supply of the price falls, some of the existing producers would leave the market because their marginal cost may not be covered by this price. The others would reduce their production and thus the overall supply would fall.
SUBMIT ASSIGNMENT NOW!