The short-run aggregate supply (SRAS) curve relates quantity of output (GDP) supplied to the price level is a positively sloped curve. At lower levels of GDP the slope of the SRAS curve is quite low (it looks to be a relatively flat in the lower range of output), but becomes steeper (i.e., the slope increase) over higher ranges of output. The typical SRAS curve is shown.
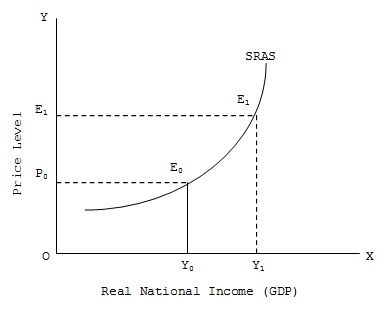
The SRAS curve shown is positively sloped, i.e., it is upward rising. However, within the range of national income O to Y0, the slope is small showing that producer are willing to produce and supply larger quantity of output even with very small rise in price level. But in the GDP range Y0 – Y1 a relatively larger increase in price level leads to a similar increase in output. And beyond Y1 only a very larger increase in price can induce even a small increase in GDP. Thus, in the lower ranges of output, SRAS is elastic and in the higher ranges it is relatively inelastic with respect to price changes.
What makes the SRAS curve upward rising or positively sloped? The answer is to be found in two interrelated propositions, viz.,
