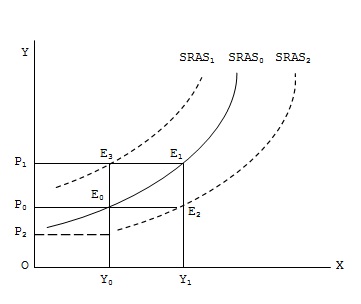
Any movement along the SRAS curve such as from E0 to E1 shows that the producers as a whole are willing to produce and offer for sale a larger quantity of aggregate output Y1 at a higher price P1 than the quantity Y0 offered at the lower price P0. But when the producers offer to produce and sell more output at the same given price or the same output at a lower price this causes a rightward (downward) shift of the SRAS curve. Similarly, a reduced quantity of aggregate output at each given price level causes a leftward (upward) shift in the SRAS curve. These shifts in the SRAS curve are called aggregate supply shocks.
SRAS0 is the original aggregate supply curve. At price P0, the producers are willing to produce an output level Y0 as indicated by the point E0 on this curve. Now, if due to some reasons such as rise in input prices, the producers are willing to produce and sell the given output level Y0 at a higher price P1, as shows by the point E3, the whole curve shifts leftwards to SRAS. This leftward shift in the aggregate supply curve shows a decrease in aggregate supply. Conversely, if due to some factors such as decrease in input prices or increase in productivity of inputs, producers as whole are willing to produce amount of aggregate output (which is larger than earlier output Y0) at the old lower price level P0, as shown by the point E2 on SRAS2, the whole supply curve shifts rightwards parallel to the original curve SRAS0¬. Thus, an increase in aggregate supply causes a rightward shift in SRAS curve while a decrease in aggregate supply result in a leftwards shift in the supply curve.