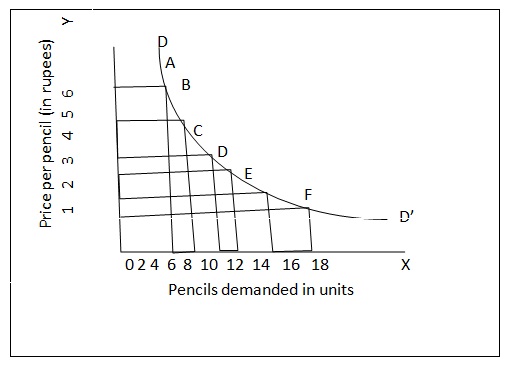
Demand curve is a geometrical representation of what demand schedule represents arithmetically.

Geometrical representation of the demand schedule given above. DD’ is the demand curve, which has been drawn by joining all the price – quantity relationships mentioned in the demand schedule. Thus at a price of $ 6 per pencil, quantity demanded is 3, which is shown by point A. other points B, C, D, E and F show all such price – quantity relationships. By joining all these points we draw the demand curve DD’.
SUBMIT ASSIGNMENT NOW!