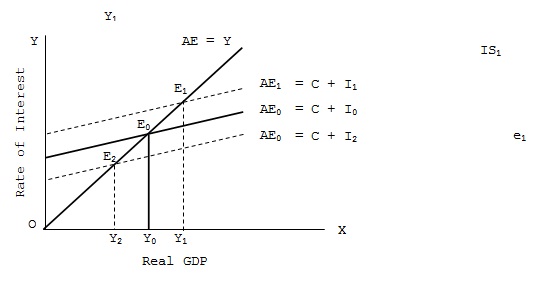
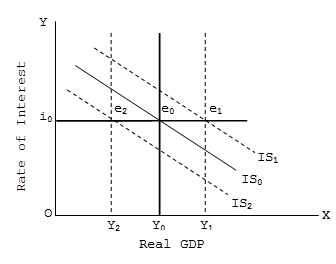
Any shift in exogenous spending, whether consumption, investment, government expenditure or net exports, will cause an upward shift in AE which would cause shifts in the IS curve. Since, we are assuming a closed economy with no government, such autonomous shifts can be either in consumption or investment. Again consumption is largely stable in the short-run, fluctuations in investment can lead to shifts in IS curve. Thus, when due to optimistic business environment, people desire to spend more on investment at each level of GDP and rate of interest, aggregate expenditure curve will shift upwards. This will, at each rate of interest, give higher equilibrium level of income than before. This will shift the IS curve rightwards.

As shown in fig. the original AE curve, viz., AE0 which has been drawn on the assumption of a given level and given rate of interest (i0) gives Y0 equilibrium level of GDP. When, at the same given rate of interest (i0), volume of investment increases by ΔI, the AE curve shift upwards from AE0 = (C + I0) to AE1 (= C + I1) where I1 = I0 + ΔI. With this upward shift the national income level rises to Y1. Conversely, with decrease in investment equal to ΔI the AE curve shift downwards to AE2 (= C + I2 where I2 = I0 - ΔI), equilibrium level of GDP declines to Y2.

In part of fig, the interest rate remains unchanged at i0. The original IS curve is IS0 which corresponds to interest rate i0 and GDP, Y0. With autonomous rise in investment (and upward shift of AE curve) GDP level goes up to Y1 while interest rate remains unchanged. This causes a rightward shift in IS curve from IS0 to IS1. The horizontal distance between IS0 and IS1 is equal to ΔY (viz., Y1 – Y0 or multiplier times ΔI). Similarly, a fall in autonomous investment and downward shift of AE curve from AE0 to AE1 leads to a fall in national income level without any change in the rate of interest. Thus, for the given interest rate i0, GDP falls from Y0 to Y2, and IS curve shifts leftwards (downwards) to IS2 at a horizontal distance equal to ΔY, viz., Y0 – Y2 or multiplier times ΔI. Thus, change in volume of autonomous investment causes upward or downward shift in IS curve.
SUBMIT ASSIGNMENT NOW!