In analyzing the performance of investment portfolios and risk management, one must understand the principles dealing with the returns on stock portfolios and the composition of these portfolios. Regardless of whether you are a student studying finance for the first time or a professional intending to specialize in investment analysis, these concepts are fundamental. Stock return analysis lets you determine the net gain/loss on an investment while portfolio analysis gives insight towards the return and risk of a collection of assets. Altogether these tools are very helpful in guiding investment decisions.

When it comes to performing these tasks, one of the powerful tools comes out to be R Studio. R Studio is an open-source IDE for R programming language used highly in statistical analysis and data analysis. For the students, the robust features of R Studio make it completely irreplaceable as it enables the manipulation of large data sets, makes a vast number of financial computations, and provides visualization through powerful graphical tools. The problem with using R is that it has a rather high learning curve, especially when it comes to developing a financial model. But, with the help of the various packages namely, quantmod, PerformanceAnalytics, Tidyquant, R Studio becomes easy to analyze stock returns and portfolios.
However, getting online guidance with your R Studio assignment helps a lot as well. Experts not only provide students with technical assistance but also share smart techniques, shortcuts, innovative practices, and methods for solving actual financial problems. Expert guidance lets students get the most out of R for finance, in particular introducing the latest methodologies to work with the stock data, measure risks, and optimize the portfolio. The aim of this guide is to introduce students to stock return and portfolio analysis in R Studio, provide hands-on learning, and allow for further resources to complement their understanding.
Before we understand the basics of R, first, define what stock return is and how to analyze stock portfolios.
Stock returns refer to the profit or loss realized on a stock in the course of a given period. They may be offered in terms of percentage or absolute values. For a student learning finance, it’s important to grasp the different types of returns:
1. Simple Returns: These point to the stock price changes expressed in percentages over a given period.
2. Logarithmic Returns: Its used to normalize returns over time and are usually more convenient for mathematical computations in the analysis of portfolios.
The formula for simple return is:
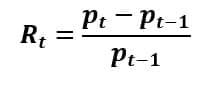
Where:
The portfolio analysis is directed toward the evaluation of a basket of stocks or assets. It allows us to compare the return on the portfolio with risk usually measured by standard deviation or volatility. The core principle is diversification; it seeks to lower risk by investing in different types of assets which have different rates of return. The overall return of the portfolio is a weighted average of the returns on the individual assets, but the risk is not a weighted average of the risks. Rather, it is a function of the covariance among the assets.
The formula for the return of a portfolio is:
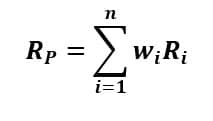
Where:
Risk is calculated as:

Where:
Because of its versatility and abundance of packages, R Studio is perfect for research and analysis in finance. Most stock data such as historical stock prices, performing statistical analysis, and visualizing insights can be done with the help of a few lines of code. In addition, R automates the analyses and builds financial models that can be easily replicate. This software is particularly useful for students in addressing issues of managing big data, backtesting strategies, and visualizing efficient frontiers and risk-return trade-offs.
To perform stock return and portfolio analysis in R, It is mandatory to install and load some essential libraries:
# Install and load essential packages
install.packages("quantmod")
install.packages("PerformanceAnalytics")
install.packages("Tidyquant")
library(quantmod)
library(PerformanceAnalytics)
library(Tidyquant)
These packages facilitates access to real financial data and include pre built functions for calculating returns, portfolio risk, and performance measures.
We will use the quantmod package to retreive historical stock data. For this example, we’ll download data for USA based tech giants like Apple (AAPL) and Google (GOOGL) from Yahoo Finance.
# Download stock data for Apple and Google
getSymbols(c("AAPL", "GOOGL"), src = "yahoo", from = "2020-01-01", to = "2023-01-01")
# View the first few rows of AAPL stock data
head(AAPL)
The getSymbols function retrieves the stock prices directly into R, making it convenience to begin your analysis.
As we have the stock data, we can now calculate the daily returns for both Apple and Google utlizing the dailyReturn function from the PerformanceAnalytics package:
# Calculate daily returns
apple_returns <- dailyReturn(AAPL$AAPL.Adjusted)
google_returns <- dailyReturn(GOOGL$GOOGL.Adjusted)
# View the first few rows of the returns
head(apple_returns)
head(google_returns)
Next, let’s create a two-stock portfolio: Apple and Google companies are in the given portfolio. To our convenience, 60% of the portfolio comprises Apple and 40% of the portfolio is invested in the Google firm. We can now calculate the return and risk (standard deviation) using the Return.portfolio function.
# Combine the returns into a portfolio
portfolio_returns <- cbind(apple_returns, google_returns)
# Define the portfolio weights
weights <- c(0.6, 0.4)
# Calculate the portfolio return
portfolio_return <- Return.portfolio(portfolio_returns, weights = weights)
# View portfolio return
head(portfolio_return)
# Calculate portfolio risk (standard deviation)
portfolio_sd <- StdDev(portfolio_returns, weights = weights)
# Print portfolio risk
portfolio_sd
It will display the expected returns and the standard deviation for the portfolio thus giving a picture of not only the portfolio performance but also the level of risk within the portfolio.
Visualization and interpretation is the key while performing financial analysis. Now, we shall generate a time series plot of the cumulative returns on the portfolio to analyze the performance over time.
# Plot cumulative portfolio returns
chart.CumReturns(portfolio_return, main = "Cumulative Portfolio Return", legend.loc = "topleft")
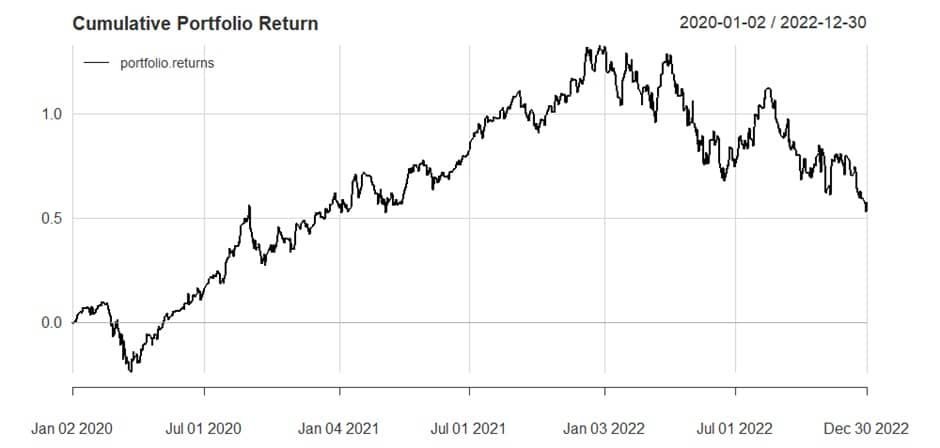
This visual chart demonstrates a clear representation of growth/decline of the portfolio over time, helping you to assess its viability in the long run.
However, to obtain a deeper view of the portfolio analysis, students can use the Sharpe Ratio, which evaluates risk-adjusted returns. A higher Sharpe Ratio means that this portfolio will give higher returns at the same level of risk.
# Calculate the Sharpe Ratio
sharpe_ratio <- SharpeRatio(portfolio_return, Rf = 0) # Rf is the risk-free rate
sharpe_ratio
This step helps students understand whether their portfolio offers a good trade-off between risk and return.
Most students taking finance courses find portfolio analysis or working on any financial case study to be difficult because of the complexity of the data, the computations involved, and the constantly changing financial theories. This is where our R Studio assignment help comes in handy. Our tutors help students to solve assignment problems with assured grades. We not only complete your assignments but help you gain helpful insights and advanced techniques.
R Studio as a software with powerful packages for financial analysis can be very challenging for a new learner. Our assignment help service makes sure that the students can understand how it is used including the technical calculations such as the portfolio returns, risk assessments, and optimization. Guiding students on advanced R packages like quantmod, PerformanceAnalytics, and Tidyquant, we contribute to the reinforcement of theoretical knowledge with practical experience. This makes R Studio an essential tool for finance students to easily handle big data and do risk assessments and portfolio optimization with high accuracy.
Another advantage of the R Studio assignment help service is the introduction of modern financial techniques. Our experts are enthusiastic professionals with industry experience and academic backgrounds, who provide students with academic as well as practical knowledge of complicated concepts as the Sharpe ratio, Markowitz Efficient Frontier, CAPM (Capital Asset Pricing Model), and the modern portfolio theory (MPT). We assist students as per their individual needs including case analysis, developing investment strategies, and conducting data driven financial analysis.
Moreover, our service provides unique viewpoints on real financial issues letting students know the current trends in the financial markets and technologies. For example, we also perform analysis of modern assets like cryptocurrencies or ESG (Environmental, Social, and Governance) investments, providing students with a complete understanding of modern finance.
Our R Studio assignment help adds to the understanding of students in a more practical way, enabling analyses such as: portfolio analysis, financial modeling, and risk analysis. The service is meant to help the students conduct their projects and apply the knowledge in future careers in finance.
Fundamental to learning in the finance course is understanding stock return and portfolio in R Studio. R’s great data handling features and financial packages make it an ideal tool when it comes to performing real life financial analysis. By following the simple steps given in this guide, students can now download stock data, compute returns, undertake risk analysis and visually analyze the portfolio performance. Moreover, for tacking coursework assignments and gaining a deeper understanding, students can opt for our R Studio Assignment help service that brings new perspectives, advanced techniques and improve analytical skills.
To further deepen your understanding of stock return and portfolio analysis in R Studio, here are some recommended resources:
