Are you a student who has encountered difficulties completing the time series analysis assignments in RStudio? This is not a reason to lose interest or give up, as you should not be intimidated by the codes or the complex concepts. The study of time series is critical to learners in statistics, biostatistics, epidemiology, data science, and data analysis. Understanding when and how data points change over time, as well as being able to extrapolate future data trends, is important in many fields. This comprehensive tutorial on time series analysis in RStudio will reveal the fundamentals of time series analysis in an understandable format for the students, with examples, coding examples, and further readings to supplement the information contained herein.
Time series analysis involves analyzing datasets that collect observations at various points in time. This type of analysis helps detect patterns such as general trends, seasonal patterns, and cyclic patterns. Time series is crucial and important tool for every student who undertakes a task of analysing a data effectively. Thus, bearing in mind that they are fundamental to the success of every data analysis jobs.
Few examples of time series analysis are studying daily stock prices, hourly temperatures in a specific area, and the weekly rate of patients admitted to a specific hospital. Analysing these patterns can help you achieve several important goals:
The technique of decomposition in time series is widely applicable to different domains, including business and finance, economics, healthcare, and environmental management. This guide aims to simplify your learning process and equip you with all the necessary knowledge and skills to excel in time series analysis.
Below is a step-by-step method of doing time series analysis. This Rstudio Assignment help guide provides a basic example of how time series analysis is conducted.
|
# Install the necessary packages if you haven’t already install.packages(“forecast”) install.packages(“ggplot2”)
# Load the packages library(forecast) library(ggplot2) |
|
# Load the AirPassengers dataset data(“AirPassengers”)
# Display the first few rows of the dataset head(AirPassengers) |
|
# Plot the time series autoplot(AirPassengers) + ggtitle(“Monthly International Airline Passengers”) + ylab(“Passengers (in thousands)”) + xlab(“Year”) |
|
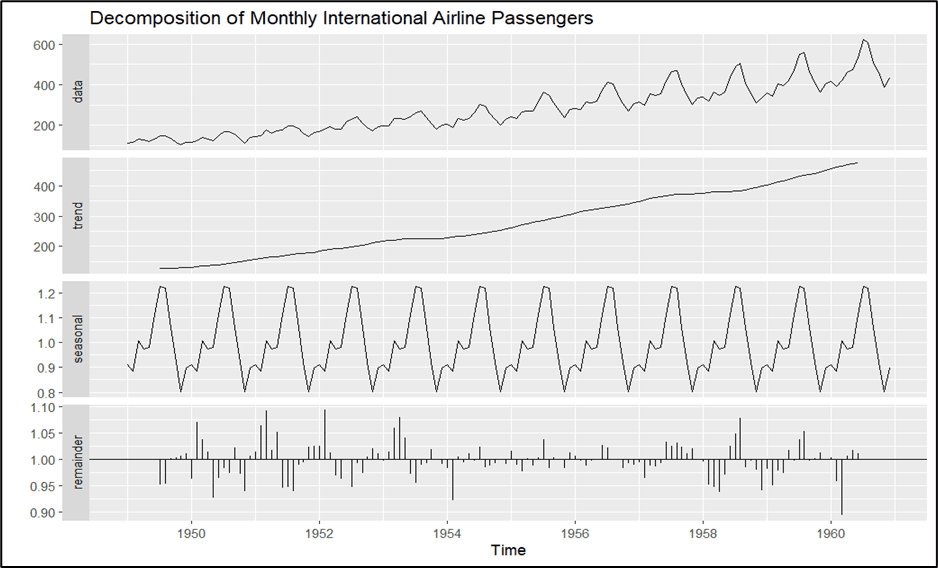
# Decompose the time series decomposed <- decompose(AirPassengers, type = “multiplicative”)
# Plot the decomposed components autoplot(decomposed) + ggtitle(“Decomposition of Monthly International Airline Passengers”) |
|
# Fit an ARIMA model fit <- auto.arima(AirPassengers)
# Display the model summary summary(fit) |
|
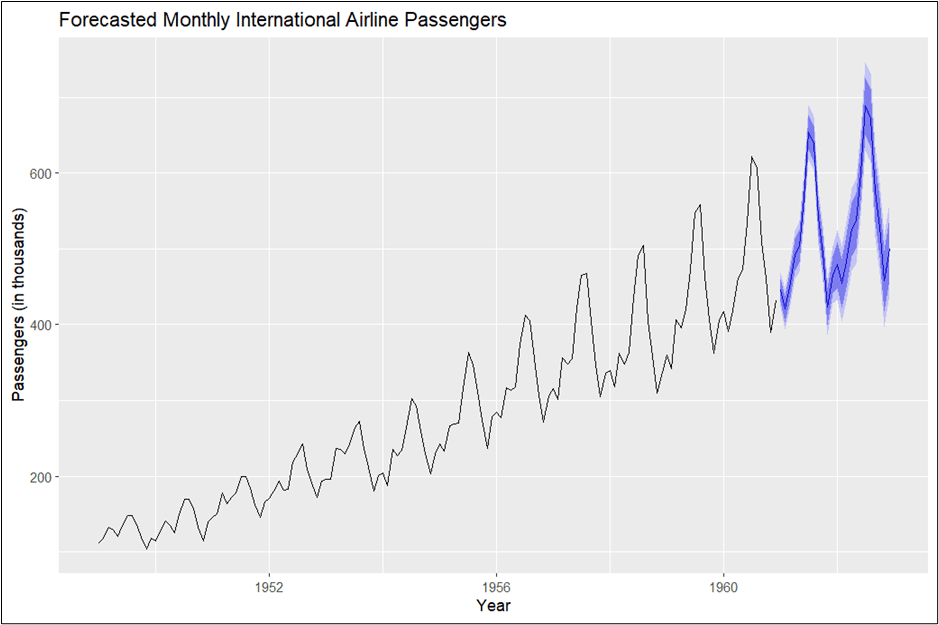
# Forecast the next 24 months forecasted <- forecast (fit, h = 24)
# Plot the forecast autoplot(forecasted) + ggtitle(“Forecasted Monthly International Airline Passengers”) + ylab(“Passengers (in thousands)”) + xlab(“Year”) |
|
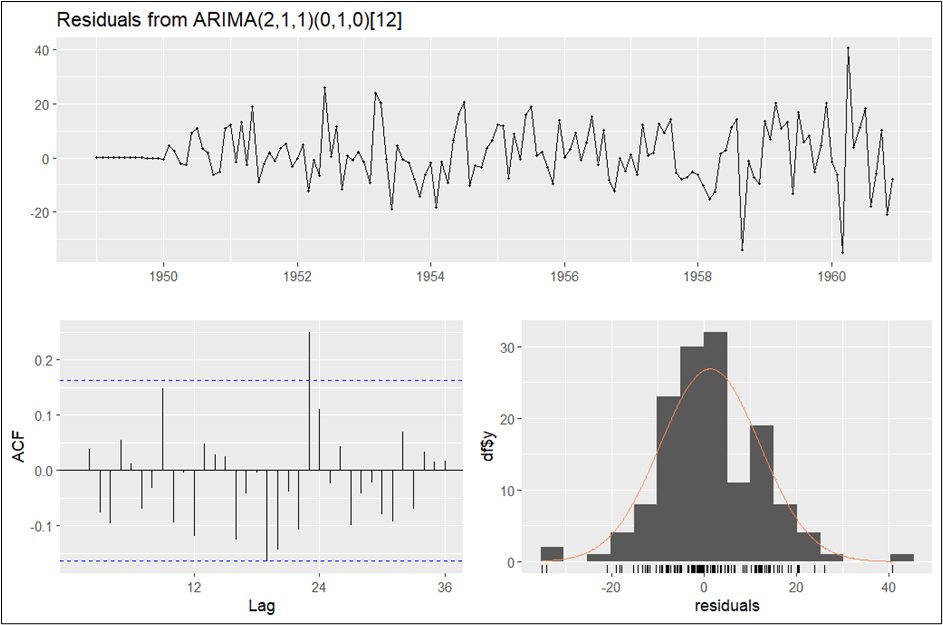
# Check residuals checkresiduals(fit) |
Time series analysis is a versatile tool that finds application in numerous fields, each benefiting from its ability to identify patterns and make predictions based on data collected over time. Let us explore some of the key areas where time series analysis is particularly impactful:
Our website offers RStudio assignment help tailored for students in the USA and UK, especially those enrolled in Statistics and Data analysis programs. Here’s how we can assist you:
We provide detailed data analysis reports that includes data cleaning, thorough analysis, and clear visualization. Our reports are designed to help you understand and present your data effectively.
Our experts offer guidance in writing error-free and efficient R code for your assignments and projects. We ensure that your code is not only correct but also optimized to get more strategic insights.
Understanding what your analysis means in the context of your research question or business problem can be challenging. We help you interpret your findings, making it easier to draw meaningful conclusions from your data.
Interpreting your results correctly is crucial for any analysis. We assist you in understanding your results and provide insights into what the data is indicating, ensuring you can make the right conclusions based on your analysis.
Besides RStudio, we offer support with other tools and software to enhance your data analysis skills:
We help you create dynamic and reproducible reports using R Markdown, making your documentation process seamless and professional.
For those who prefer a graphical user interface for statistical analysis, we provide assistance with R Commander, simplifying your analysis tasks.
Our expertise isn’t limited to R. We also offer guidance on other statistical software, including SAS, JMP, Minitab, and SPSS, ensuring you have the tools you need for comprehensive data analysis.
Our team of seasoned experts provides you with the best possible assistance, ensuring you understand and excel in your assignments.
By letting us handle the complex analysis, you can focus on learning the underlying concepts and theories, making your learning process smoother and more efficient.
Improved Grades
With our high-quality analysis and correct coding support, you can significantly boost your course performance, leading to better grades and a deeper understanding of the subject matter. Our comprehensive RStudio assignment help services are designed to support you in every aspect of your data analysis tasks, from writing efficient code to interpreting complex results, ultimately enhancing your learning experience and academic success.
For further reading and deepening your understanding of time series analysis, consider the following resources:
Books:
Online Courses:
