The Iso-cost Line shows the various combination of two factor inputs which the firm can purchase with its given outlay. Its given outlay (budget), can buy either OR of factor K or OM of factor L. joining the points R and M, we get the iso – cost line RM which shows that the firm can buy, with its given outlay, any combinations of L and K on this line. In other words all the combination of L and K on this line cost to the firm an equal amount. Now, if the firm has a larger outlay to make, it can buy more of L, say ON or more of K say, OS. The line SN is an Iso – cost line showing the various combinations of L and K which the firm can buy with this increased outlay. SN is an iso – cost line showing a higher outlay than the line RM. Similarly, TP is an iso – cost line showing a still higher amount of outlay by the firm and all combination of L and K on this line would cost line is also called the price line as it shows the price of one factor in OR of K and price of ON of L is OS of K. the slope of the iso – cost line is equal to the ratio of prices of two factors expressed in terms of opportunity cost because when we buy OM of L, we have to sacrifice OR of K and purchase of OR of K means sacrifice of OM of L.
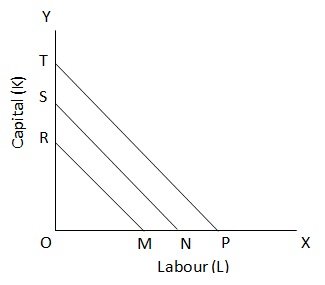
Thus, Slope of iso cost line = price of factor L / Price of factor OK
= OR /OM = OS /On = OT /OP.
The iso-cost line or price line is also called the total outlay line as it shows the total expenditure of the firm on buying L and K.
