The LM curve has been drawn on the assumption of a given price level, given stock of wealth and a given quantity of money. A change in any one of the above variables assumed to be constant, will shift the LM curve upwards or downwards. Let us assume the price level and the stock of wealth as given and see how do changes in money supply affect the position of the LM curve.
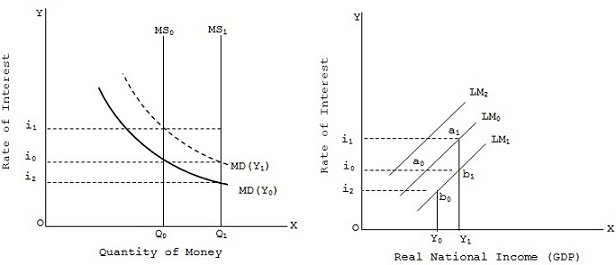
Money supply is fixed at Q0 (with MS0 money supply curve) while original demand for money at income Y0 is MD(Y0) and i0 is the rate of interest. With an increase in GDP from Y0 to Y1, the money demand shifts upward to MD(Y1) and rate of interest increase to i1. Corresponding to these interest rates i0 and i1 and GDP levels Y0 and Y1,the curve LM0 is drawn in fig. Now if money supply curve shifts from Ms0 to Ms1(viz., money supply increase from Q0 to Q1), then with the original MD(Y0) curve, the rate of interest falls to i2. This means that now at the income level Y0, demand for money and supply of money are equal at lower interest rate i2. This given the money market equilibrium point b0 in fig similarly, at income level Y1, money market equilibrium takes place at interest rate i0.
This gives point b1 of money market equilibrium joining points b0 and b1, we get the curve LM1 which is below the original curve LM0. This shown that an increase in money supply shifts the LM curve rightwards. Similarly, a decrease in money supply shifts the LM curve leftwards as shown by LM2.Thus, an increase in money supply produces a lower equilibrium rate of interest for each level of GDP and shifts the LM curve downwards (rightwards). Conversely, a decrease in money supply produces a higher equilibrium rate of interest for each level of income and pushes the LM curve upwards (leftwards).
SUBMIT ASSIGNMENT NOW!