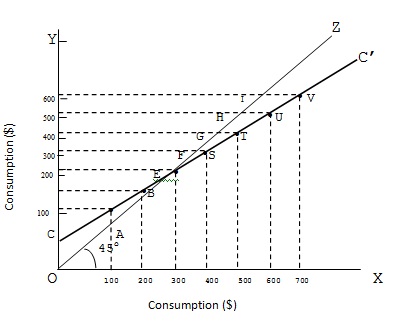
When the consumption function r the consumption income relationship is shown the form of a diagram, we get the consumption curve. In other words, the consumption curve is a geometrical presentation of the consumption function which is drawn on the basis of a given consumption schedule. The following diagram shows the consumption curve which has been drawn on the basis of the data given in the earlier consumption schedule.
| Income | Consumption | Savings |
| 0 100 200 300 400 500 600 700 |
60 140 220 300 380 460 540 620 |
-60 -40 -20 0 20 40 60 80 |